The Spring Boot framework provides the ability to monitor and manage your application by using Spring Boot Actuator.
This module is intended to be used for auditing, health, and metrics gathering, but it can also open a hidden door to your server when misconfigured (for example set a proper log level of your application at runtime). If you are not familiar with it, you can study full documentation on the official page.
The Actuator module allows to reach all available endpoints by using HTTP protocol or by Java Management Extensions (JMX). I am not a big enthusiast of exposing management endpoints as a public API, so the reasonable solution is JMX and JConsole duet.
Problem description
If your Spring Boot application is dockerized and managed by Docker Compose, you can face the issue with JMX connection. The problem becomes more complicated if you want to connect JConsole to the application installed on the external server and started inside a Docker. My attempts to connect JConsole to the remote JMX endpoints leads me to the following errors:
java.rmi.ConnectIOException: error during JRMP connection establishment;
nested exception is: java.io.EOFException
or
java.net.ConnectExceptionThe Solution
Before we start…
Before providing you the full description, I would like to introduce my assumptions:
- the application is dockerized and run by Docker ENTRYPOINT instruction:
ENTRYPOINT ["java", "-jar", "app.jar"]
- the Docker Compose handles all my project’s components
- the JMX port won’t be exposed publicly, the access to the JMX will be established by SSH port forwarding or SOCKS Proxy.
How to configure it…
- Enable the JMX feature inside your application by setting the following property in the
application.propertiesfile:spring.jmx.enabled=true - In the
Dockerfiledefine and expose the JMX port (the 5000 in our case):EXPOSE 5000 - Inside your
Dockerfiledefine followingENVstatement:ENV JAVA_TOOL_OPTIONS "-Dcom.sun.management.jmxremote.ssl=false \ -Dcom.sun.management.jmxremote.authenticate=false \ -Dcom.sun.management.jmxremote.port=5000 \ -Dcom.sun.management.jmxremote.rmi.port=5000 \ -Dcom.sun.management.jmxremote.host=0.0.0.0 \ -Djava.rmi.server.hostname=0.0.0.0"The tricky part here is passing all configuration to the JAVA_TOOL_OPTIONS instead of JAVA_OPTS environment variable.
- In your
docker-compose.ymlfile map the port by adding following line in ports section:ports: - 5000:5000 - Run the Spring Boot application by using the command:
docker-compose up -d
How to run it…
As I mentioned earlier, the 5000 port is not exposed publicly to the Internet. I will use the SOCKS proxy to connect the JConsole to my application. In order to do it, follow these steps:
- In your console, run listed below SSH command to establish SOCKS proxy connection:
ssh -fN -D 7777 YOUR_HOST - Run the JConsole with following parameters:
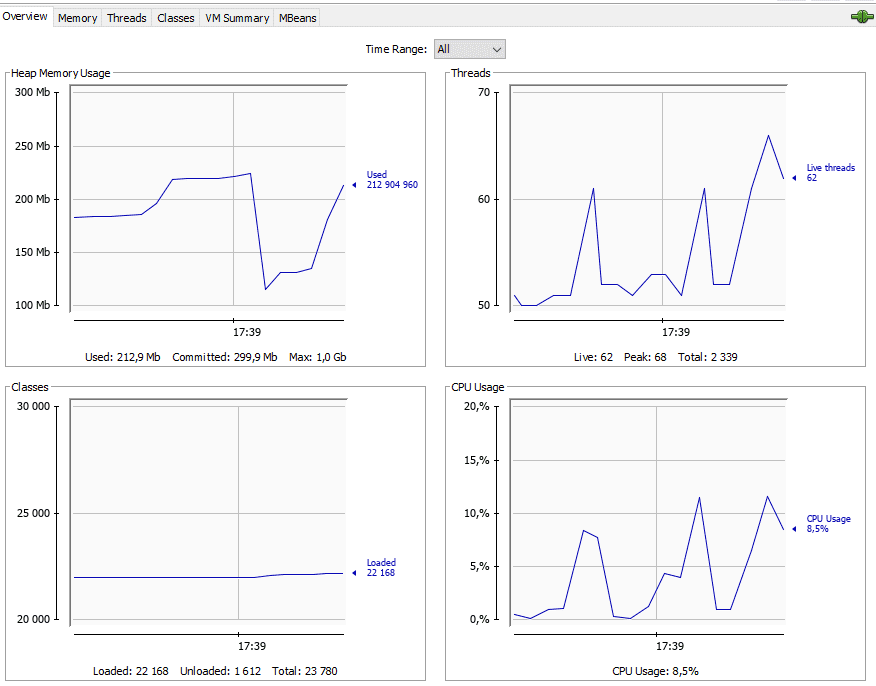
jconsole -J-DsocksProxyHost=localhost -J-DsocksProxyPort=7777 service:jmx:rmi:///jndi/rmi://localhost:5000/jmxrmi -J-DsocksNonProxyHosts=You should be able to see your JConsole panel similar to this one:
Summary
The Spring Boot Actuator is a powerful tool to monitor and manage your application. Think twice about the security and don’t expose the sensitive endpoints to the public network.
Would you like to talk with our experts about technology solutions for your business?
Q: What is Spring Boot Actuator?
Spring Boot Actuator is a module intended for auditing, health, and metrics gathering in Spring Boot applications.
Q: How can I access Actuator endpoints?
Actuator endpoints can be accessed using HTTP protocol or Java Management Extensions (JMX) and JConsole.